

At Frugal Gnome, the concept of discretionary income (DI) is used to measure your true wealth, i.e., how much financial freedom you have. (DI is the amount of money you can choose how to spend, as opposed to the portion of your income that pays for necessary expenses and financial obligations.)
DI is not a constant, though. It changes over time. If you look at individual households, the changes are the result of decisions around income and spending. When you look at the broader economy, you see that economic swings cause the average DI of all households to change. And it’s different across age groups.
Because we focus on building DI, we explore everything we can about the subject. That includes taking steps to measure it in different ways as we do in our new study: the DI Index.
Using data from the Bureau of Labor Statistics, Frugal Gnome created the DI Index to track its characteristics nationally. The index lends insight into what effect different situations have on discretionary income, which can help you forecast the impact your own decisions could have on your DI.
How the DI Index is calculated
The basic formula for discretionary income is as follows:
DI = Net Income – (Necessary Expenses + Minimum Obligations)
Measuring the average DI of American households provides a real-world view of the economy. In general, it shows when people have plenty of money to spare and when they are struggling to cover even the most basic expenses.
The Bureau of Labor Statistics (BLS) produces annual statistics on the income and expenditures of American households. To calculate national DI figures, Frugal Gnome analysts went through the list of expenditures to determine which were necessary expenses and minimum obligations. Then it subtracted these expenditures from after-tax income.
Taking the last ten years’ worth of data, Frugal Gnome calculated the average DI for each of those years.
The BLS also sorts its consumer expenditure statistics into different population groups, including age groups. To track how DI changes as people move through their careers and into retirement, Frugal Gnome also calculated an average DI for each of seven age groups.
Below is an analysis of the results of this study.
Average DI has shown strong growth over the past 10 years
First, here’s a look at the year-by-year average U.S. DI:
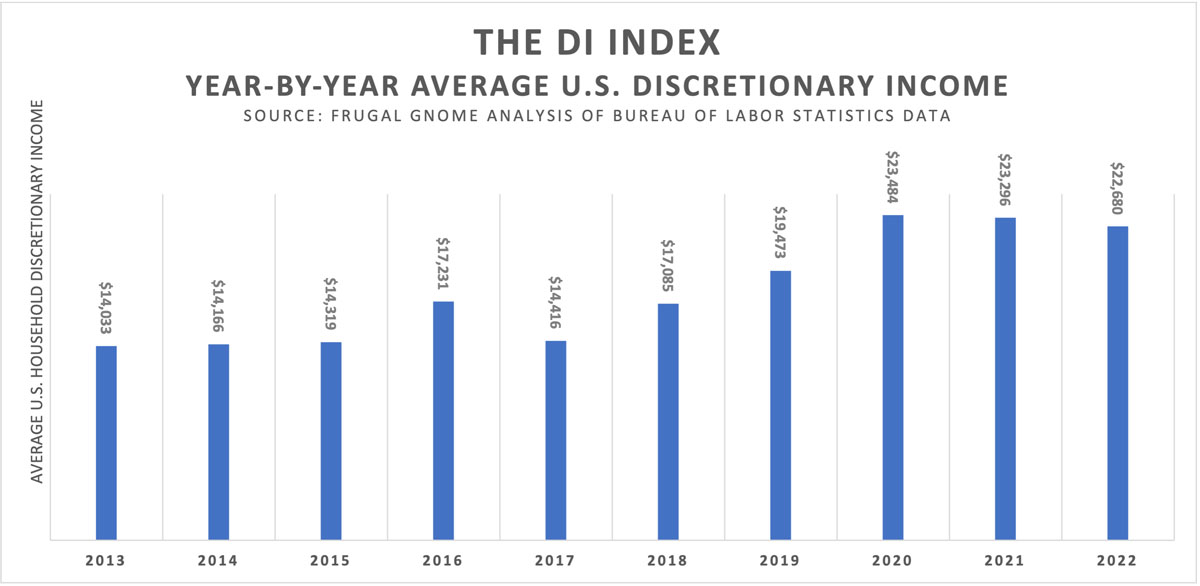
Overall, average DI has had a good ten years. The DI for the most recent year is 61.62% higher than the DI for the first year. This is a healthy rate of growth even when you measure it against inflation, as shown here:
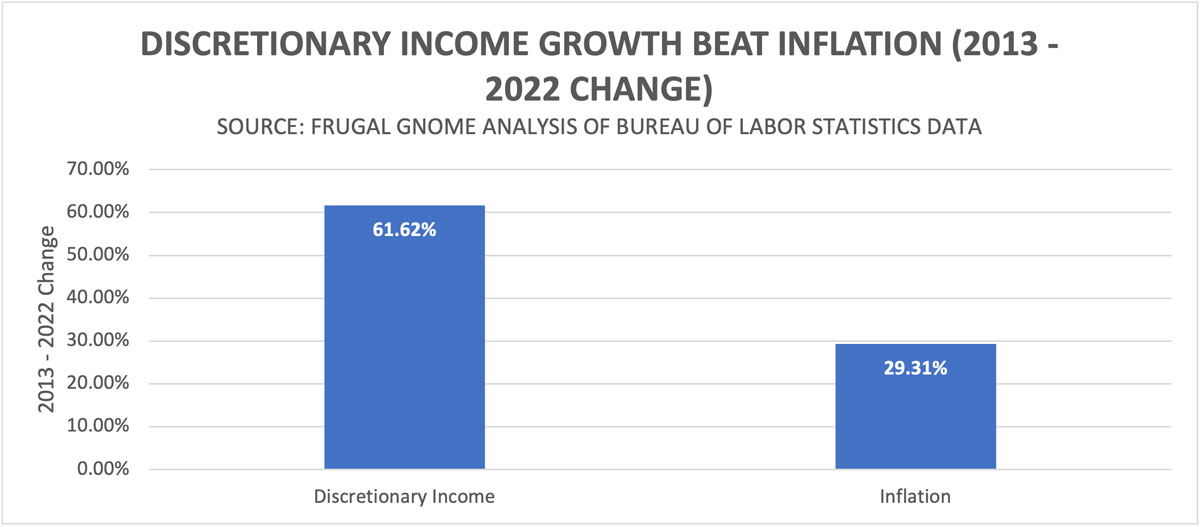
As the above chart shows, the growth in discretionary income has been roughly double the change in the Consumer Price Index over the past 10 years.
So far, so good. There is just one discouraging note, which you may have noticed if you looked closely at the year-by-year DI chart: average DI has slipped slightly in each of the last two calendar years.
Comparing income and non-discretionary expense growth
To understand changes in DI, it helps to break it down into its two major components: income and expenditures:
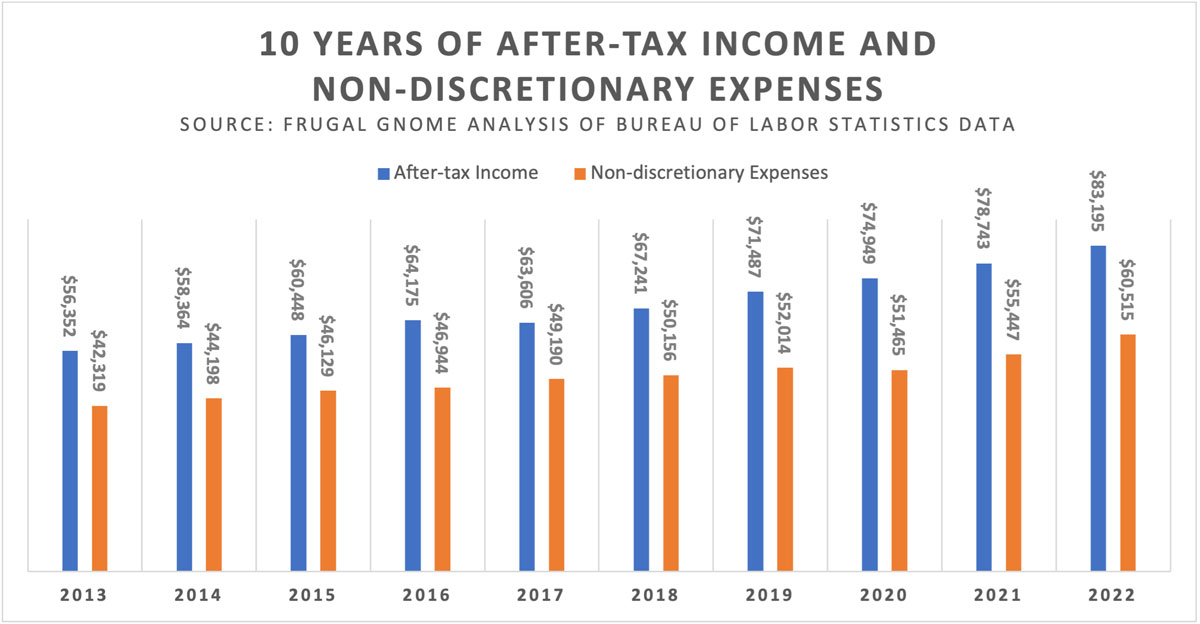
The chart above shows year-by-year figures for average after-tax income and total necessary expenses and minimum obligations. The difference between the two is DI.
Over the full period, after-tax income grew by a total of 47.63%, while expenditures grew by 43.00%.
You may recall that over the same period, DI grew by 61.62%. The fact that after-tax income grew more rapidly than basic expenses is one reason DI could grow at a faster rate than income.
That is important to remember when you think about how to improve your own financial situation. The part of your income that can influence how well you live, the discretionary income, is driven by both income gains and expense control. You can get ahead by working at both ends of the equation: making more money and managing your expenses carefully.
However, this same principle can also work against you. As noted previously, average DI declined over the past couple of years. This happened despite the fact that average after-tax income increased by 11% during that period.
The reason? Basic expenses increased by 17.58% during that same two years. It goes to show that if your basic expenses are growing more rapidly than your income, it is going to squeeze your DI.
Discretionary income typically rises then falls with age
Besides the year-by-year changes in DI that occur as economic conditions evolve, there are also changes that generally occur throughout an individual’s life cycle.
Here is Frugal Gnome’s breakdown of 2022’s average DI for various age groups:
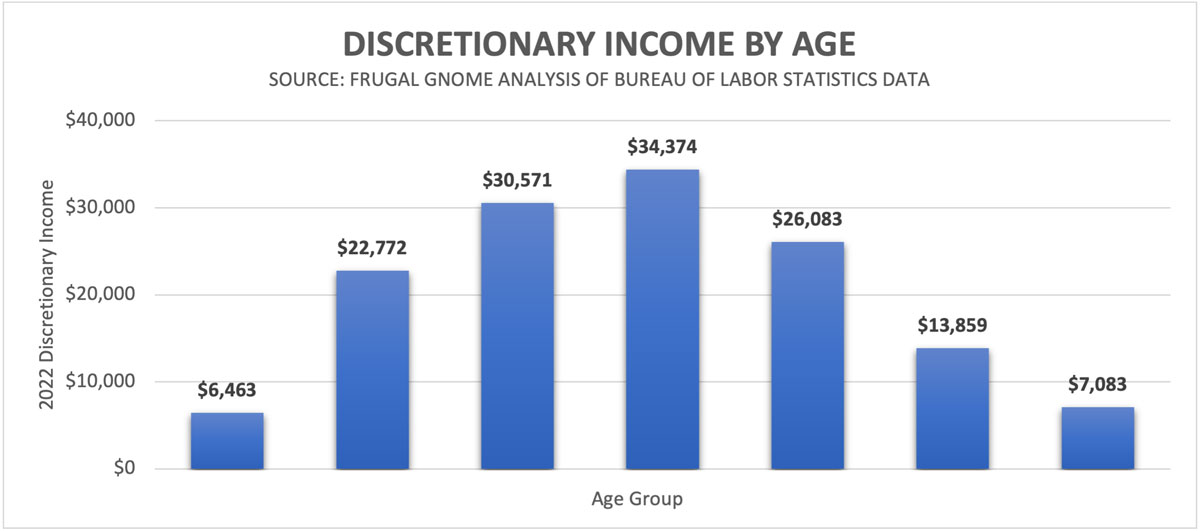
As you might expect, it is rather hard to get DI as a young adult. The good news is that it increases rapidly over the next 30 years or so. The bad news is that DI drops off pretty steeply later in life.
In fact, that drop-off may come earlier than you might think, with DI peaking in the 45-to-54 age group – a decade or more before the traditional retirement age. Also, the decline in DI can be surprisingly drastic. The average DI for a household headed by a person 75 or older is about a fifth of the DI for a household headed by someone aged between 45 and 54.
Comparing income and expenses by age
Once again, breaking DI into its component parts can shed light on how DI changes throughout a person’s life cycle.
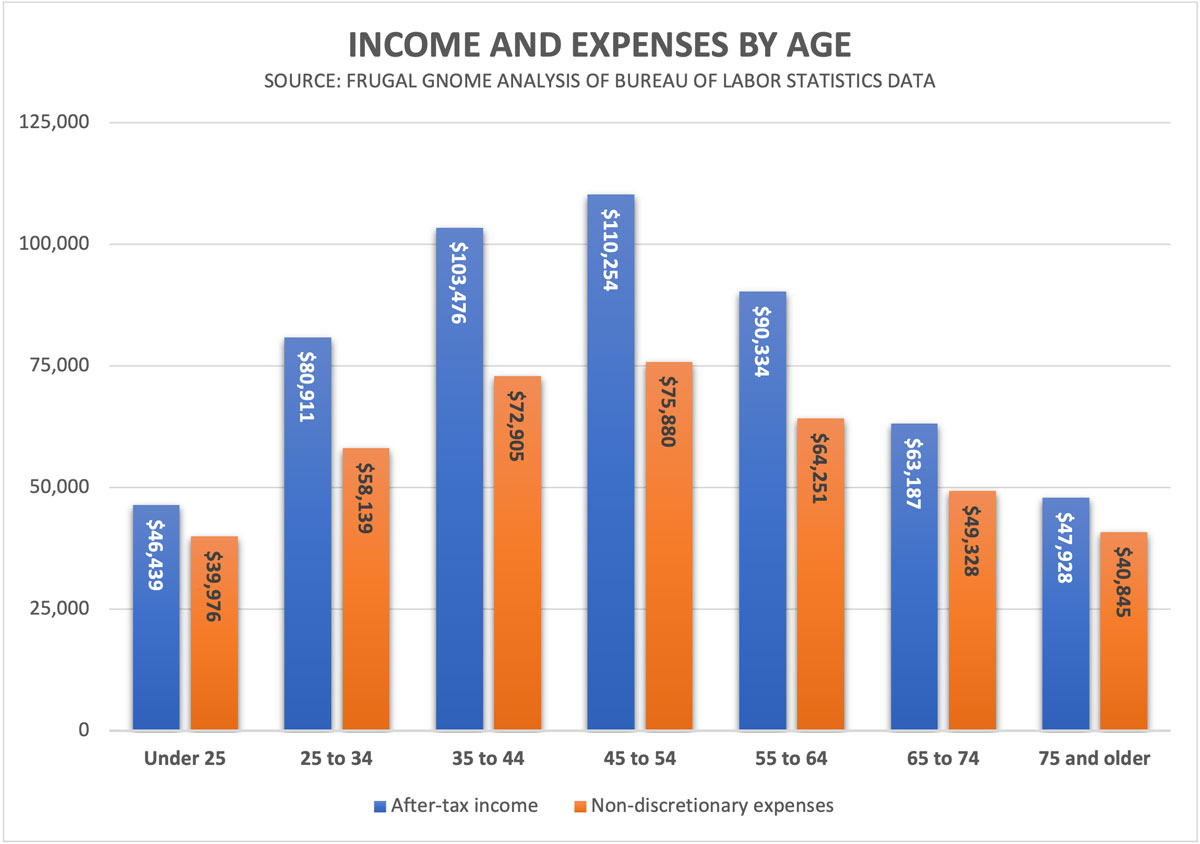
As this chart shows for young adults, after-tax income and basic expenses are pretty close together. Remember, those are just minimum expenses and basic financial obligations. That does not include all expenses. Once you throw in a little extra for having a social life, travel and cultural or sporting events, it is no wonder people under age 25 have trouble making ends meet.
Fortunately, for most people in the job market, income starts to rise considerably after that. Expenses also rise as people opt for a bigger place to live, a nicer car and other lifestyle upgrades. The important thing is that, from age 25 to age 54, incomes generally grow more quickly than expenses. That is why DI is able to grow.
From age 55 on, people typically see this process reverse. Average incomes start to drop off pretty rapidly at that point. Expenses also start to decline, but more slowly than income. That is why DI drops so steeply as people age.
Understanding how DI changes as one ages can help you make appropriate decisions about budgeting and retirement planning.
Implications for budgeting
In terms of budgeting, a key lesson is that you shouldn’t let expenses rise as quickly as income. In other words, don’t spend money as fast as you make it. Later on, when income starts to drop, it is tough to bring expenses in line fast enough.
This lesson applies to the natural decline in income that occurs later in life, but it is also something to remember when you have a one-time financial windfall or other non-recurring source of income.
Examples can include a one-time bonus at work or an unusually large investment gain. A common experience with this type of thing occurred during the pandemic, when many Americans received government stimulus checks.
When those checks stopped coming, discretionary income took a hit. People who had raised their spending to the level supported by those stimulus checks had a harder time making ends meet after the stimulus stopped. This is one reason the average DI has fallen off recently.
Implications for retirement planning
The changes to DI that happen as people age can also inform the decisions you make about retirement planning:
- Since DI declines rapidly for most people from age 55 on, it is crucial to maximize retirement savings in the peak DI decades prior to that.
- Seeing how rapidly incomes decline later in life, you have to plan for how you could cut expenses later on. For example, paying off a mortgage in your peak DI years can allow your housing expenses to drop considerably later on. This should ease the drop-off in income you are likely to experience.
- Remember that any borrowing you do in your peak DI years is likely to squeeze DI later in life. For one thing, if you can’t support your lifestyle in those high-earning years without borrowing, you will find it even tougher when income starts to decline. Also, any debt you rack up earlier in life will only add to your expenses later on, when there is less income to cover your payments.
Experience is a great teacher. Unfortunately, when it comes to finances, lessons from your own experiences are often too expensive. Viewing how DI changes over time allows you to learn from the typical experiences of others, so you can make better decisions about your future before it’s too late.
Methodology
Frugal Gnome used consumer expenditure data from the BLS to calculate average DI figures. This included after-tax income and expenditures deemed by Frugal Gnome to fall into the category of “necessary expenses & minimum obligations.”
There are some lifestyle choices inherent in those expenditures, so they don’t represent the bare minimum necessary to get by. For example, the decision to buy a bigger house or live in a more expensive neighborhood may result in a larger mortgage payment. While this would represent a choice rather than an absolute necessity, it would create an ongoing financial obligation. Thus, it would be subtracted from after-tax income in calculating DI.
All figures are based on the BLS definition of a “consumer unit.” This may be one or more persons living together and dependent on the same financial resources.
Sources:
Consumer Expenditure Surveys
Bureau of Labor Statistics
Demographic tables : U.S. Bureau of Labor Statistics (bls.gov)
Consumer Price Index
Bureau of Labor Statistics
CPI Home : U.S. Bureau of Labor Statistics (bls.gov)